The data
export capability of the Platinum version of PARS Reporter includes
an excel export routine that can quickly be transformed into 3D charts
and pivot tables in less than 2 minutes.
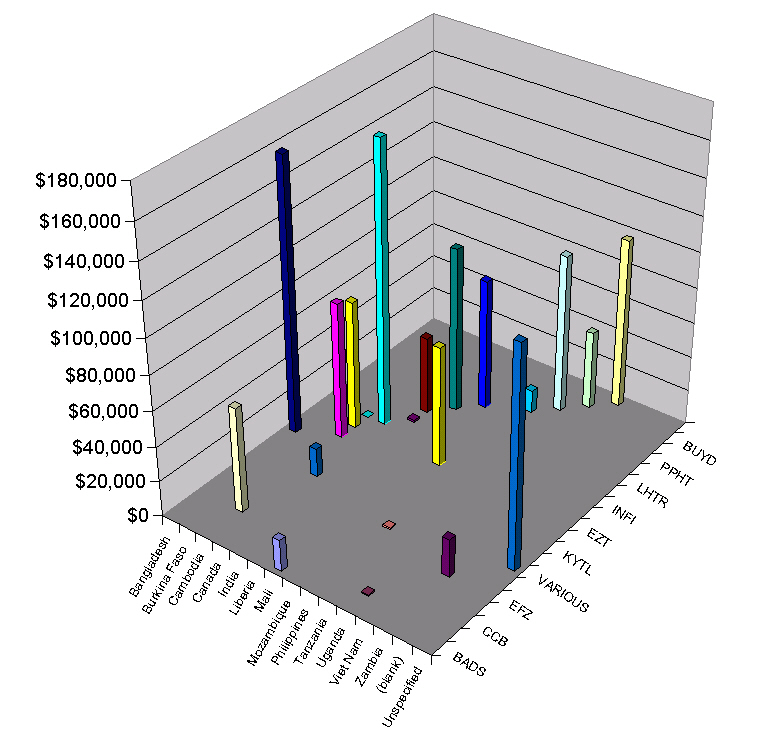
The example
below shows a pivot chart displaying Total Contribution by Country by
Partner for a fictitious NGO. Charts and the associated tables can quickly
be created via Excel and other spreadsheet tools from automatically
prepared data exports out of PARS Reporter. Similar charts and tables
can be derived for Sector, ODA Priority, Region and Theme views.
Charts
are not limited to 3D views. 2D Bar, Stacked Bar, Pie, Scatter Plots,
Radar Plots and others are available via your speadsheet software.